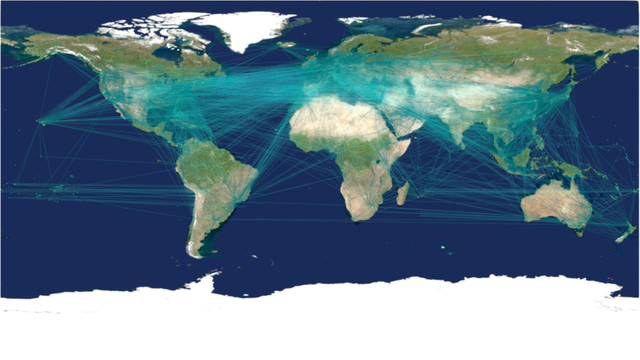
New York Subway
This project constructs a visual exploration system for understanding the spatial structure of New York City's subway network.
Rather than presenting routes as static maps, it derives layered spatial relationships — lines, entrances, access fields, policy boundaries, and ridership intensity — to make hidden structural patterns legible.
The focus is not on conclusions, but on clarity: how infrastructure, access, and administrative boundaries coexist within the same spatial system.
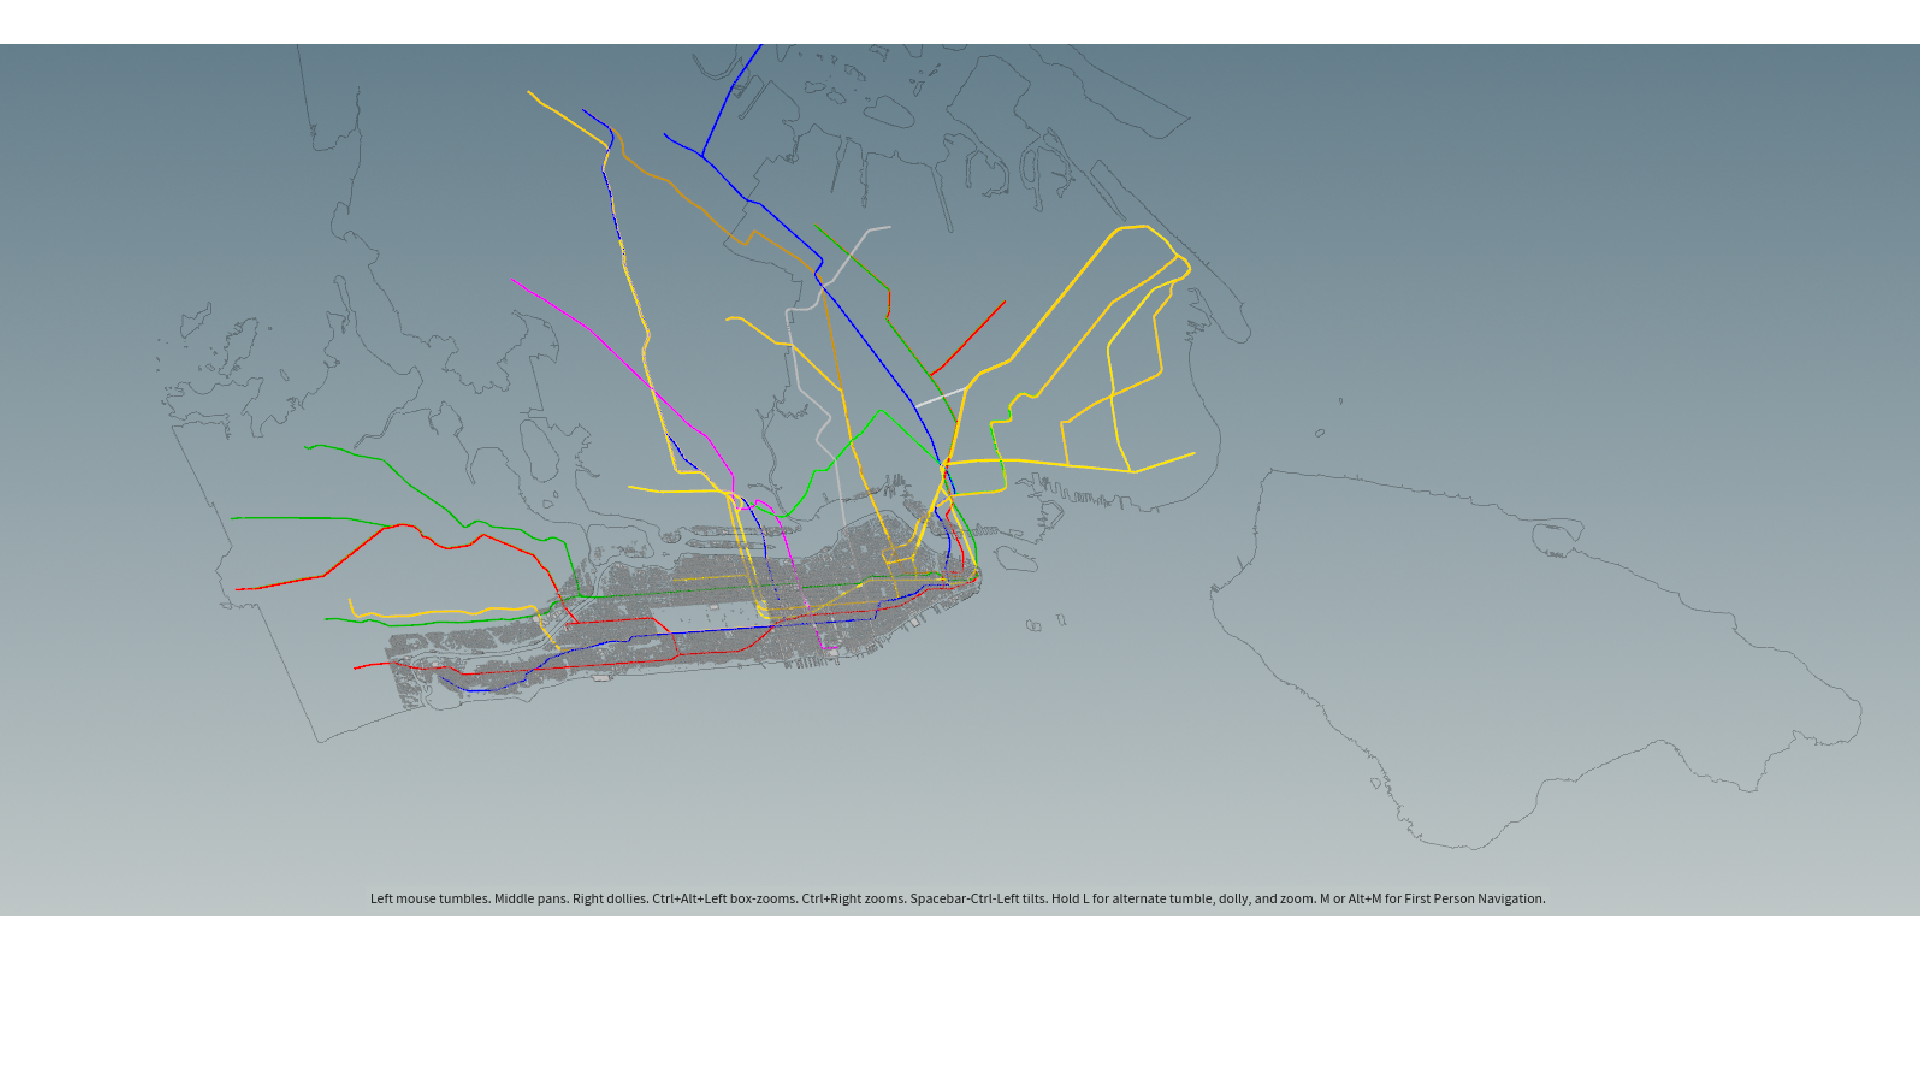
This project visualize how subway infrastructure, pedestrian access, and policy boundaries intersect
System Process
Inputs:
- NYC building footprint dataset (polygon geometry)
- GTFS subway lines + stations
- Station entrances (point dataset)
- School district polygons
- Station-level ridership table
Processing:
- Geometry cleaning and projection normalization
- Attribute extraction (height, footprint area if available)
- Aggregation by block / grid / spatial clustering
- Optional extrusion or density field conversion
Derived Layers
- Entrances → Access Fields Point data expanded into walk-distance influence zones
- Access Fields × District Polygons Intersection operations reveal areas of overlap between mobility and administrative boundaries.
- Lines → Proximity Zones Distance-based classification of nearby buildings.
- Ridership → Intensity Scaling Station metrics normalized and mapped to visual weight.
Output:
- Scalable urban structure visualization
- Multi-scale rendering (macro to micro)
System Logic
- The subway network is treated as a layered spatial system:
- Lines define structural topology.
- Entrances define real pedestrian access.
- Buffers convert points into spatial influence fields.
- Policy districts introduce administrative segmentation.
- Ridership scales intensity within the network.
Each layer operates independently but can be composed to study interactions between infrastructure, access, and governance.
LINES → ENTRANCES → ACCESS FIELD ↓ DISTRICT INTERSECTION ↓ RIDERSHIP SCALE
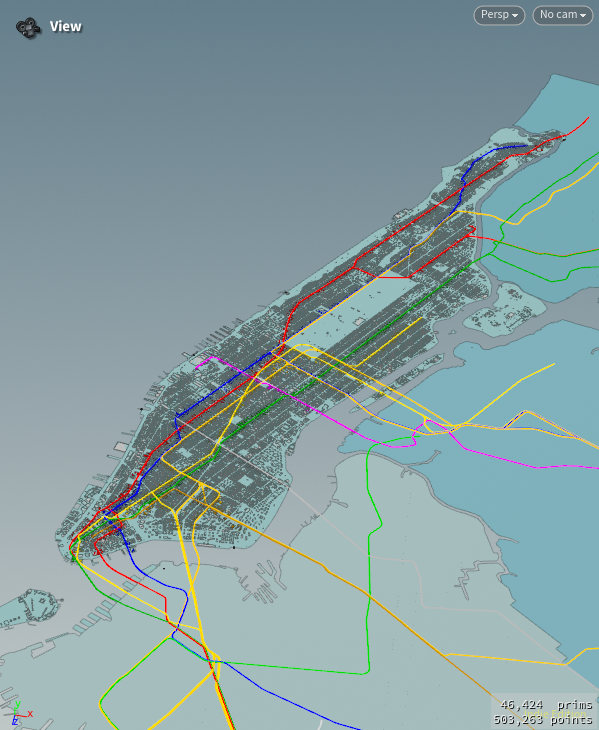
Network Skeleton (Lines)
What it reveals: trunk corridors, borough connectivity, redundancy vs fragility
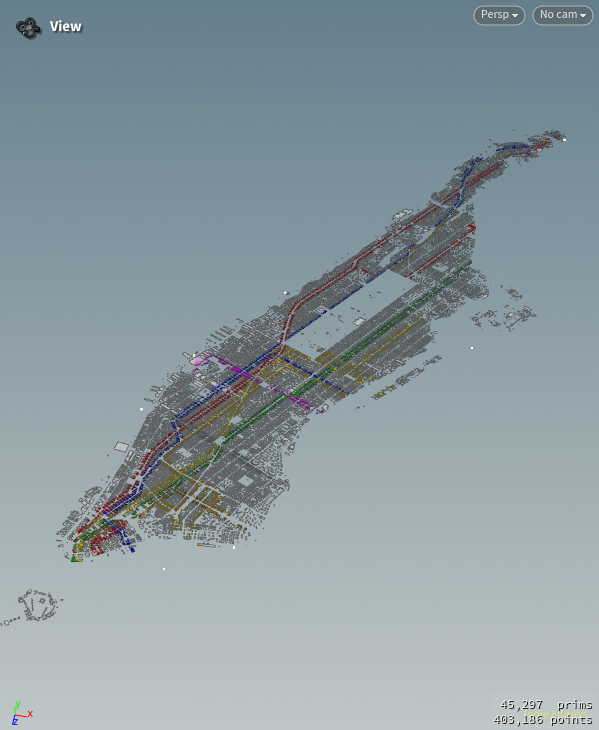
Access Field (Entrances → Walk Catchments)
What it reveals: “real access” is entrances, not lines
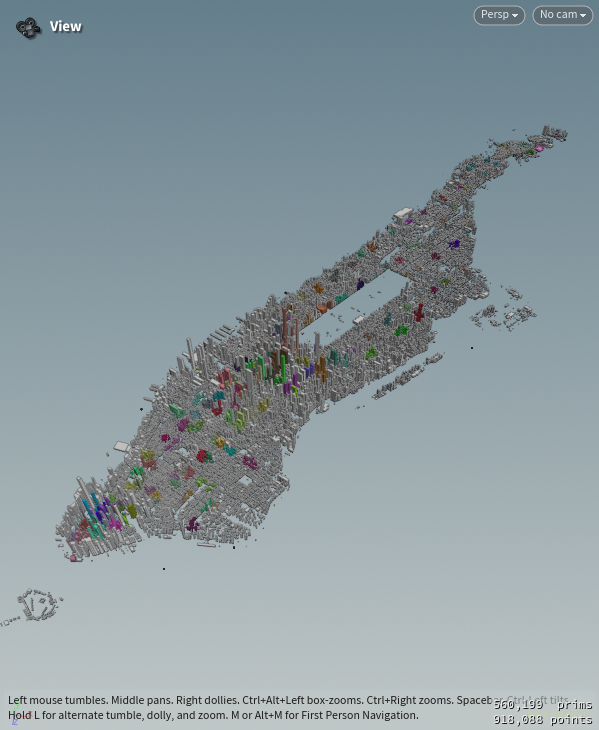
Boundary Intersection (School Districts × Access Field)
What it reveals: where policy boundaries don’t match mobility reality
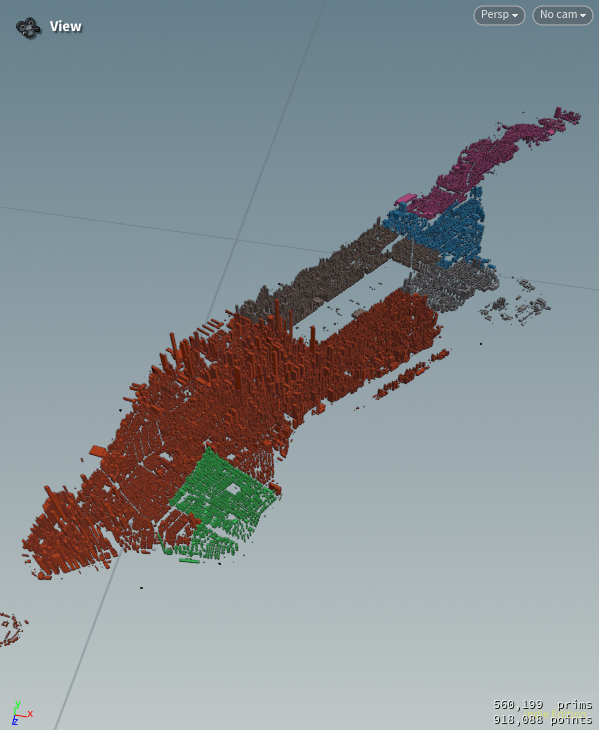
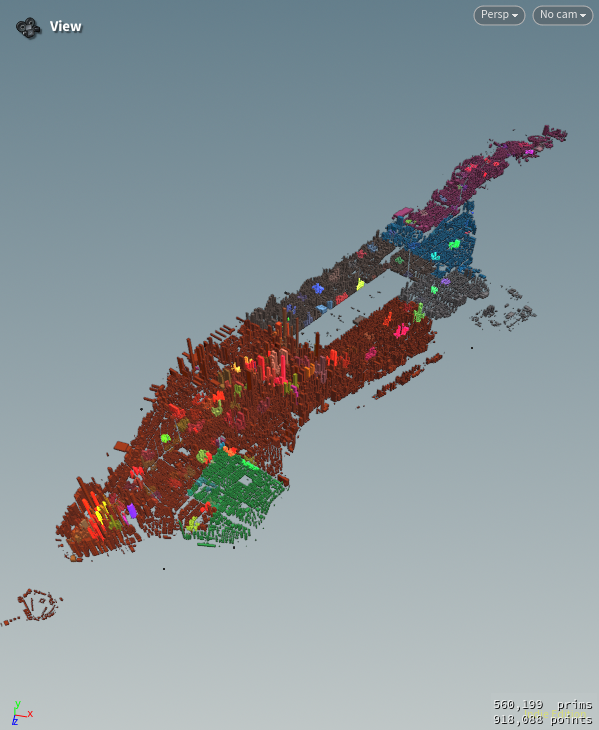
Load & Hierarchy (Ridership)
What it reveals: hubs, spokes, imbalance, “center of gravity”